STIR/SHAKEN statistics from September 2026
September 2026 STIR/SHAKEN and robocall statistics are now available. The data show the latest trends in robocalls, STIR/SHAKEN participation, and attestation level usage. Let's have a look.
We've been publishing monthly STIR/SHAKEN statistics since April 2021. These numbers are gathered from hundreds of voice service providers using our STIR/SHAKEN and robocall prevention solutions. The data describe calls they received from other voice service providers that originated calls, including some robocalls, signed with STIR/SHAKEN.
Signed robocalls by attestation level
Robocalls remain level across most attestation levels
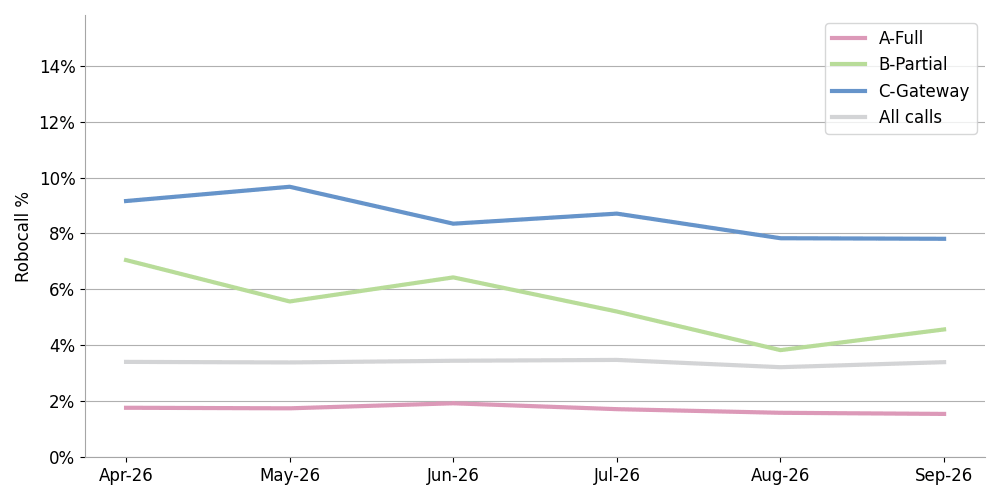
Figure 1. Signed Robocalls by Attestation Last 6 Months
Figure 1 shows signed robocalls by attestation level over the past six months. Overall, the statistics in September were mostly level with August across all attestation levels. Robocalls among all calls were 3.4%, up from 3.2% in August. Robocalls signed with A-level attestation were 1.6%, the same as the previous month. Robocalls among calls signed with B attestation were 4.6%, up 0.8% from August. Robocalls among calls signed with C attestation were 7.8%, the same as August.
STIR/SHAKEN participation and coverage
We measure STIR/SHAKEN participation changes in two ways:
- The number of Originating Service Providers (OSPs) signing calls received by our customers,
- Service providers authorized to do SHAKEN by the STI Policy Administrator (STI-PA).
The number of SHAKEN signers increased
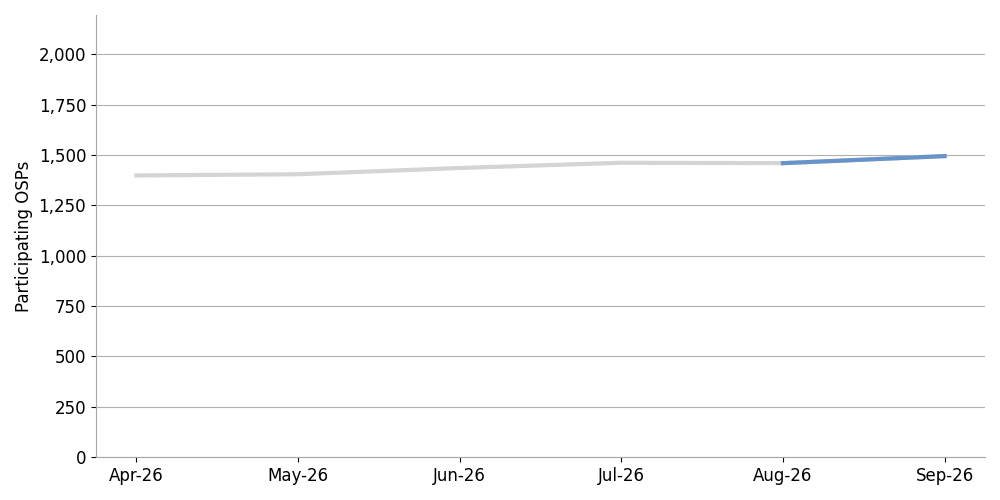
Figure 2. Monthly Number of OSPs Sending Signed Calls
Figure 2 shows that, after a slight dip in August, the number of Originating Service Providers (OSPs) observed signing calls in September was back up 2.4% from the previous month.
The number of SHAKEN-authorized providers increased slightly
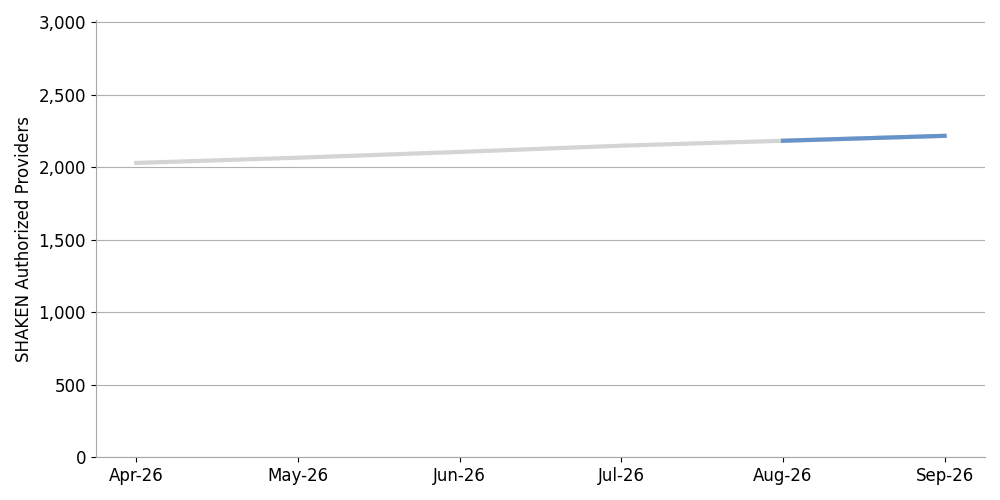
Figure 3. STIR/SHAKEN Authorized Providers by Month
Figure 3 shows that the number of SHAKEN-authorized providers in September was up 1.6% from the previous month.
STIR/SHAKEN coverage
Signed calls at termination remain level
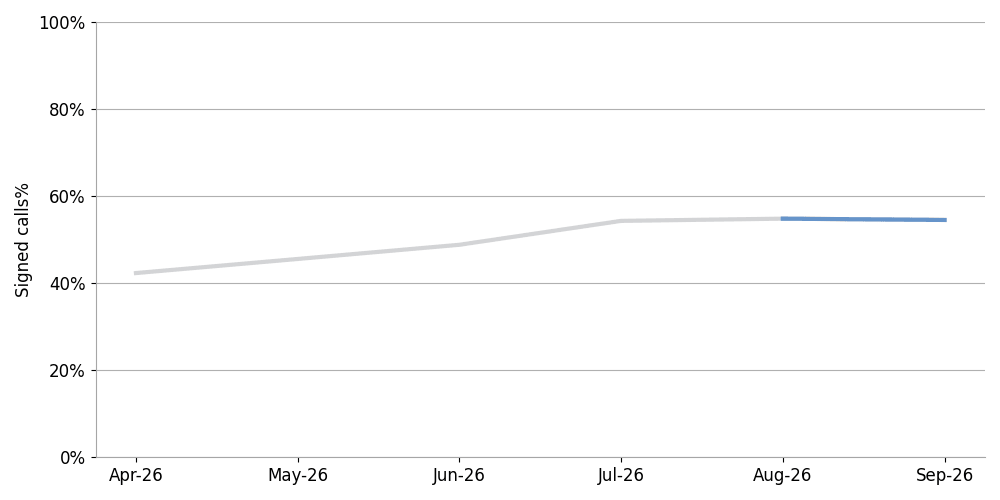
Figure 4. The Percentage of Signed Calls at Termination Last 6 Months
Figure 4 shows the percentage of signed calls at termination for the past six months. This was down 0.3% in September, to 54.5%. This statistic has been hovering around 54% for three months.
Calls signed with A-level attestation down slightly
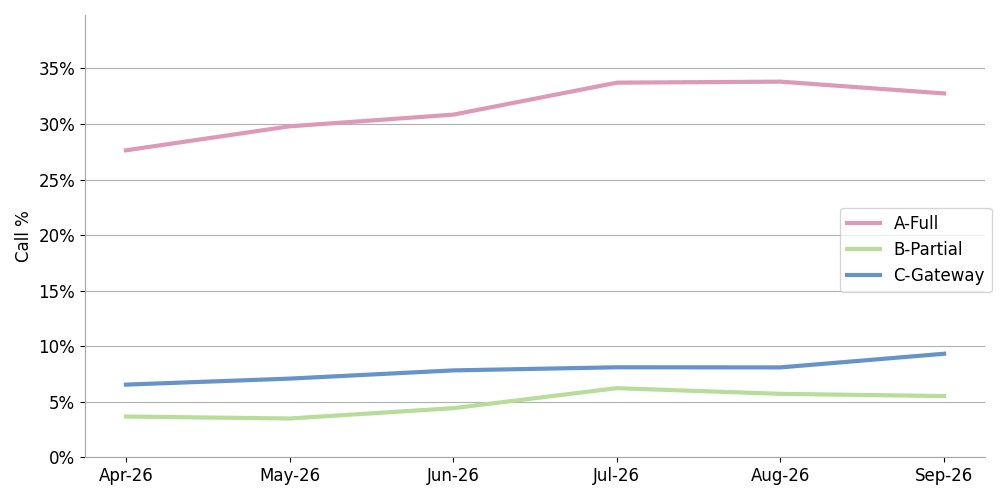
Figure 5. Percentage of Calls with SHAKEN Attestation Levels Last 6 Months
Figure 5 shows the percentage of calls signed by attestation level. The percentage of calls signed with full A-level attestation was 32.8% in September, down 1.0% from the previous month. The percentage of calls signed with B-level attestation was 5.5%, down 0.2% from August. The percentage of calls signed with C-level attestation was 9.3%, up 1.3% from the previous month.
Branded Calling ID™ enables voice service providers to generate revenue from branded calls they originate or terminate.
Learn more about Branded Calling IDPatterns among prolific robocall signers
Here are robocall and attestation statistics for the top 10 SHAKEN-authorized providers ranked by the percentages of signed calls identified as robocalls.
Robocalls from prolific robocall signers down slightly
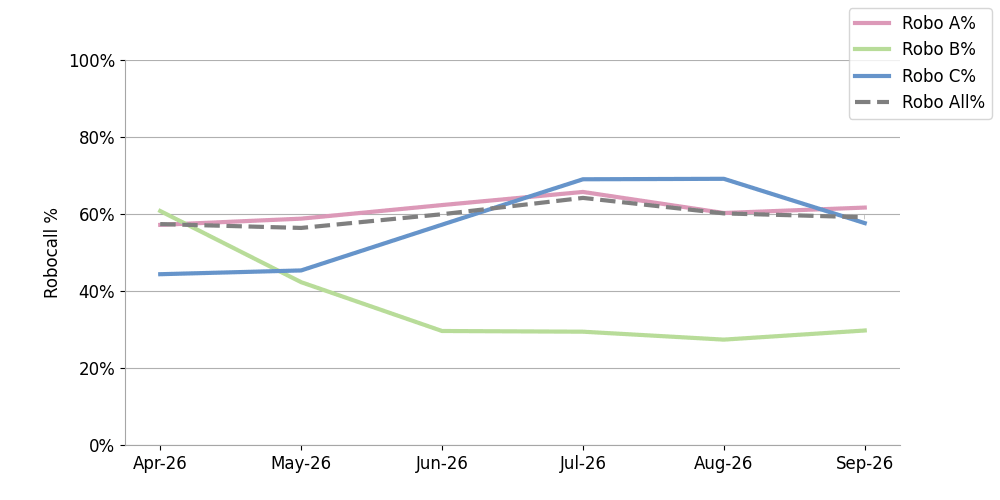
Figure 6. Robocall Percentage by Attestation—Prolific Robocall Signers by Robocall %
Figure 6 shows robocalls authenticated by the top 10 robocall signers ranked by robocall percentage over the past six months.
In September, the robocall percentage among prolific robocall signers was down 1.0% from August. The robocall percentage with A-level attestation was down 0.4%. The percentage of robocalls among calls signed with a B-level attestation was up 2.4%. The robocall percentage among calls signed with a C-level attestation was down 11.5%.
Prolific robocall signers authenticate most calls with A-level attestation
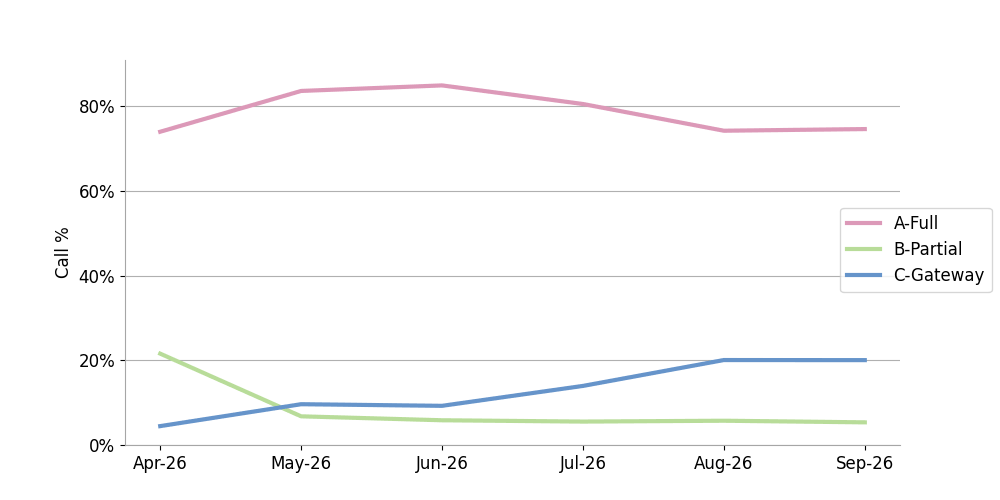
Figure 7. Call Percentage by Attestation—Prolific Robocall Signers
Figure 7 shows the percentages of calls signed by the top 10 robocall signers by authentication level. In September, 75% of the calls authenticated by the top ten prolific robocall signers had an A-level attestation. 5% of their calls had a B-level attestation, and 20% had a C-level attestation.
Recap
- Robocall percentages were mostly even with August.
- STIR/SHAKEN participation improved slightly. The number of SHAKEN signers was up 2.4%, and the number of authorized providers increased 1.6%.
- STIR/SHAKEN coverage has been level around 54% for the third month in a row.
- Robocalls authenticated by prolific robocall signers decreased slightly from August. They signed 75% of their calls with an A-level attestation, 5% with a B-level attestation, and 20% with a C-level attestation.
TransNexus solutions
TransNexus is a leader in developing innovative software to manage and protect telecommunications networks worldwide. The company has over 25 years of experience in providing telecom software solutions, including toll fraud prevention, robocall mitigation and prevention, CDR and call analytics, advanced call routing, billing support, STIR/SHAKEN, and branded calling.
Contact us today to learn more.
Our STIR/SHAKEN products:
- Work with your existing network
- Support SIP and TDM
- Affordable, easy to deploy