STIR/SHAKEN statistics from April 2023
The April 2023 STIR/SHAKEN and robocall statistics are in. These figures show improvements in some areas. An analysis of prolific robocall signers sheds new light on robocall signing patterns.
We’ve been publishing monthly STIR/SHAKEN statistics since April 2021. These numbers are gathered from over 100 voice service providers using our STIR/SHAKEN and robocall prevention solutions. The data describe calls they received from 582 other voice service providers that originated calls, including some robocalls, signed with STIR/SHAKEN.
Many robocalls are signed with B or C attestation
Calls signed with B attestation Were 4.4 Times more likely to be robocalls

Figure 1. Robocall % by Verification Status
Figure 1 compares the percentage of robocalls by attestation level, for unsigned calls, and for all calls in April 2023. Notice that calls signed with B- or C-level attestation include a high percentage of robocalls. Calls signed with B-level attestation were 4.4 times more likely to be robocalls than unsigned calls.
Robocalls signed with B or C attestation persist
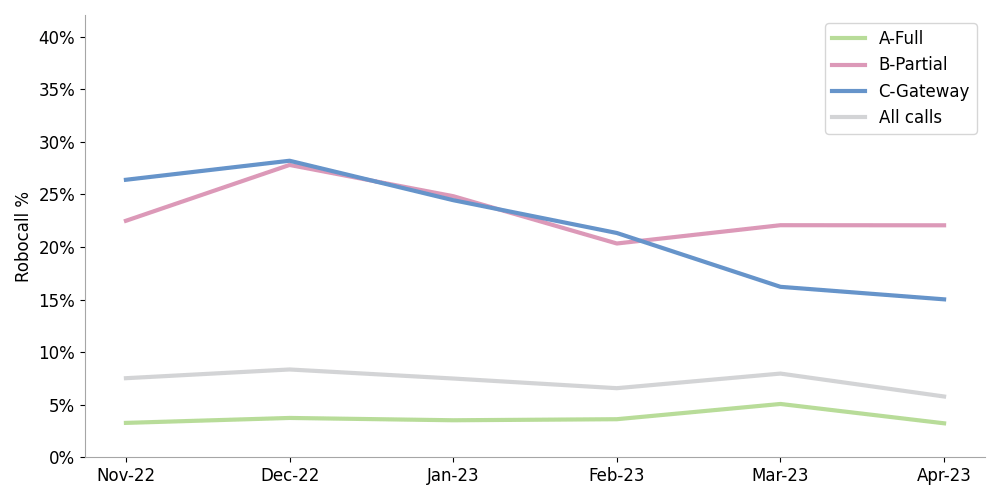
Figure 2. Signed Robocalls by Attestation Last 6 Months
Figure 2 shows this trend over the past six months. Notice that the red and blue lines (B and C calls) are much higher than the gray line (all calls). Fortunately, the percentage of robocalls among calls signed with C-level attestation has been on a downward trend, from 26.39% in November to 15% in April. Unfortunately, the percentage of robocalls among calls signed with B-level attestation has been hovering around the 20%–28% range.
SHAKEN participation is picking up
We measure STIR/SHAKEN participation changes in three ways:
- Originating Service Providers (OSPs) signing calls received by our customers
- Service providers authorized to do SHAKEN by the STI Policy Administrator (STI-PA)
- New certification filings in the Robocall Mitigation Database (RMD).
SHAKEN signing is gaining momentum
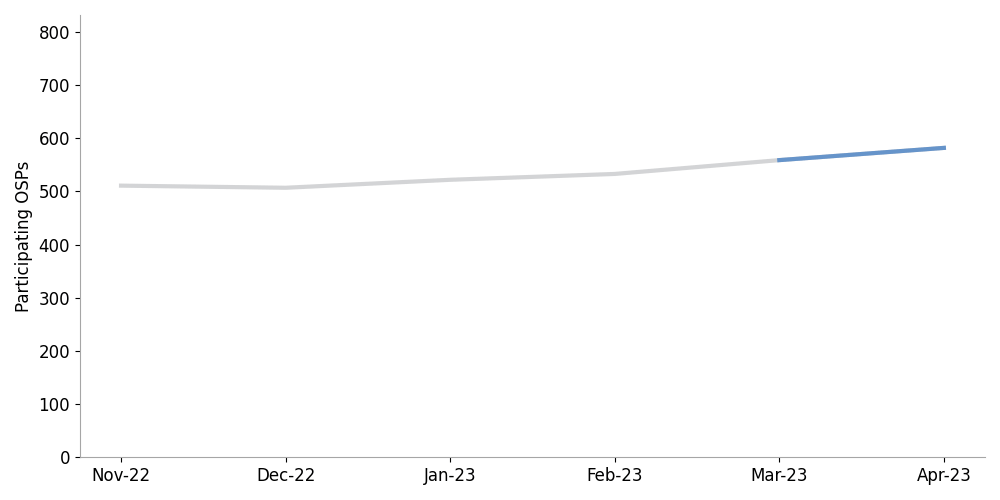
Figure 3. Monthly Number of OSPs Sending Signed Calls
Figure 3 shows the number of Originating Service Providers (OSPs) signing calls. This had been increasing by about 10/month in previous months. However, we observed 23 new SHAKEN signers in April.
A large increase in the number of SHAKEN-authorized providers

Figure 4. STIR/SHAKEN Authorized Providers by Month
Figure 4 shows the number of SHAKEN authorized providers. As with OSP signers, this number has an upward trend that has been increasing in recent months. There were 90 new SHAKEN authorized providers in April, the largest monthly increase we’ve seen.
New Robocall Mitigation Database filings trickle in
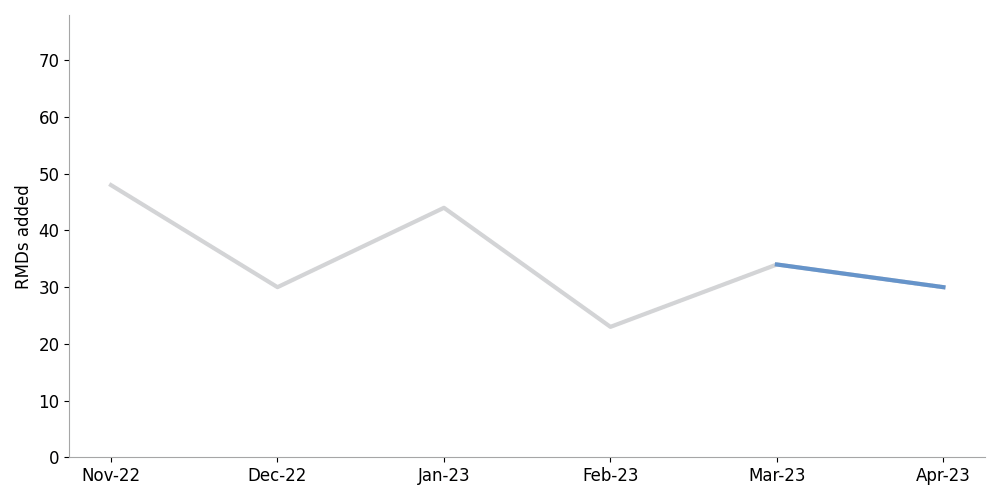
Figure 5. New Robocalls Mitigation Database Filings by Month
Figure 5 shows that new certification filings in the Robocall Mitigation Database are trickling in. There’s been a slight downward trend in new RMD filings, with some volatility. We expect this number to jump when the new RMD filing requirements in the Sixth Order become due.
These three measures show that the STIR/SHAKEN participation trend is picking up momentum as we approach the June 30 deadline for small facilities-based and gateway providers.
Most calls reach their destination unsigned
Most calls arrive unsigned
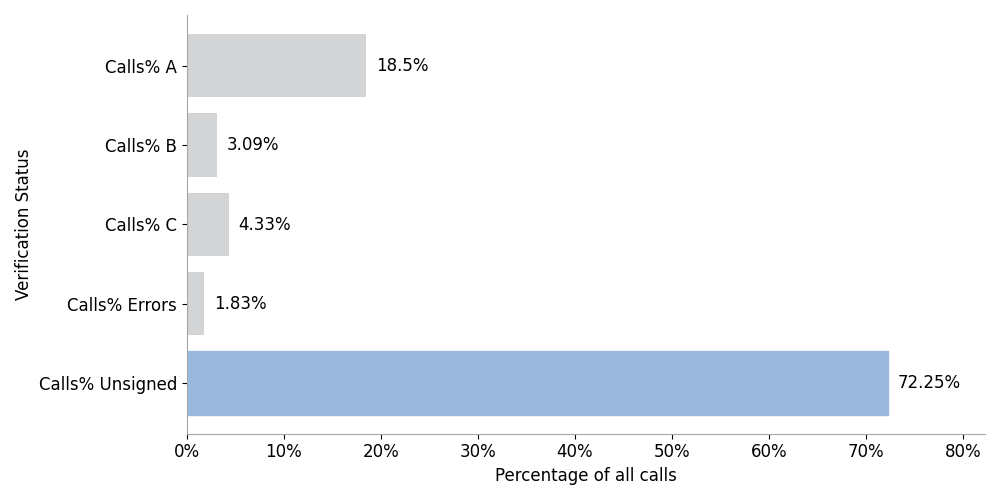
Figure 6. Percentage of Calls by Verification Status
Figure 6 shows that the vast majority of calls arrive for termination unsigned.
Signed calls at termination stalls
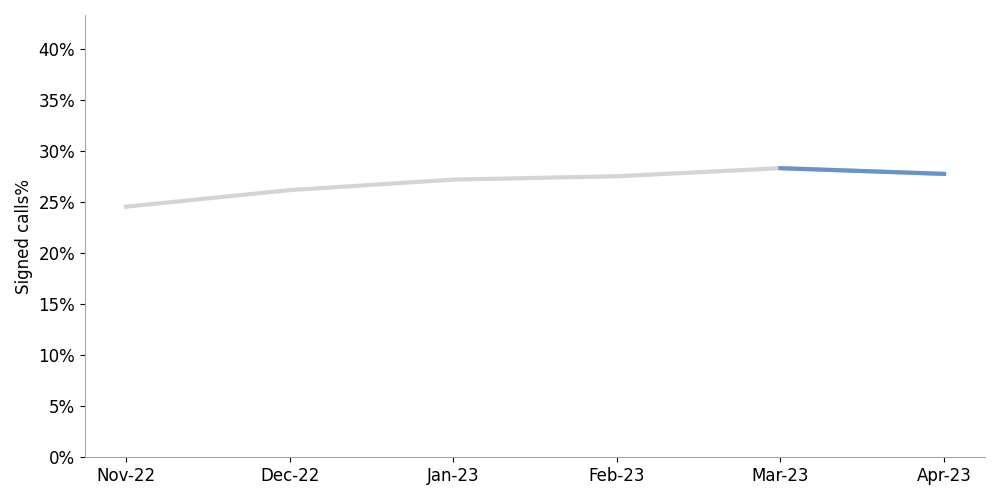
Figure 7. The Percentage of Signed Calls at Termination Last 6 Months
Figure 7 shows the percentage of signed calls at termination for the past six months. This figure had been hovering around 24%. In recent months, we’ve observed this number slowly increasing, reaching 28.3% in April.
Calls with full attestation improving
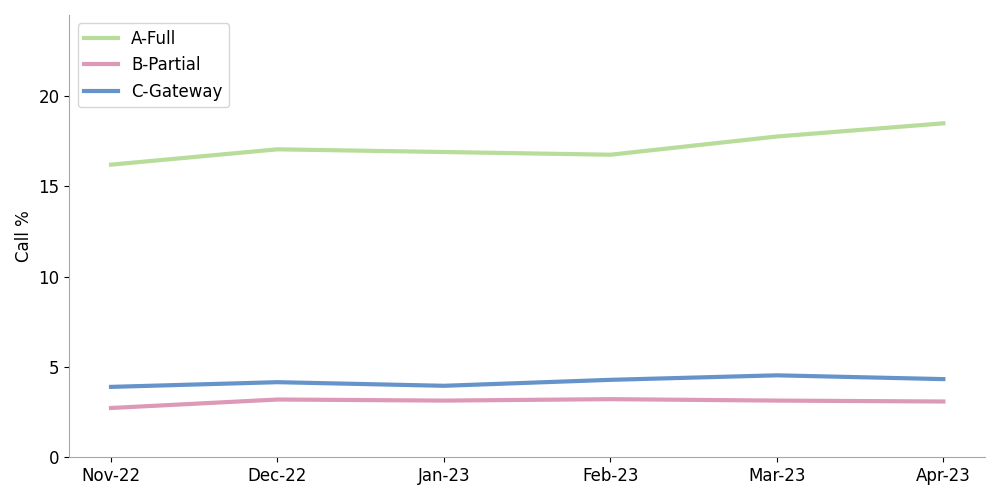
Figure 8. Percentage of Calls with SHAKEN Attestation Levels Last 6 Months
Figure 8 shows that the percentage of calls signed with full attestation has been inching up slowly over the past six months, from 16.21% in November to 18.5% in April. We view this as one of the most important trends in the set, as full attestations are the most useful for robocall prevention. However, the new analysis described below reveals problems with some A-level attestations.

Patterns among prolific robocall signers
We thought we might gain deeper insight into call authentication and robocall trends by analyzing SHAKEN and robocall statistics for prolific robocall signers. These are SHAKEN-authorized providers that either:
- Had the highest percentages of robocalls among their signed calls or
- Put the most signed robocalls on the network.
We prepared two datasets, one for the top ten signers with the most robocalls, and another for the top ten signers with the highest percentages of robocalls. We collected this data for the past 12 months ending in April 2023. Here’s what we found.
Signing providers with the highest robocall percentages
Robocalls with A-level attestation increasing
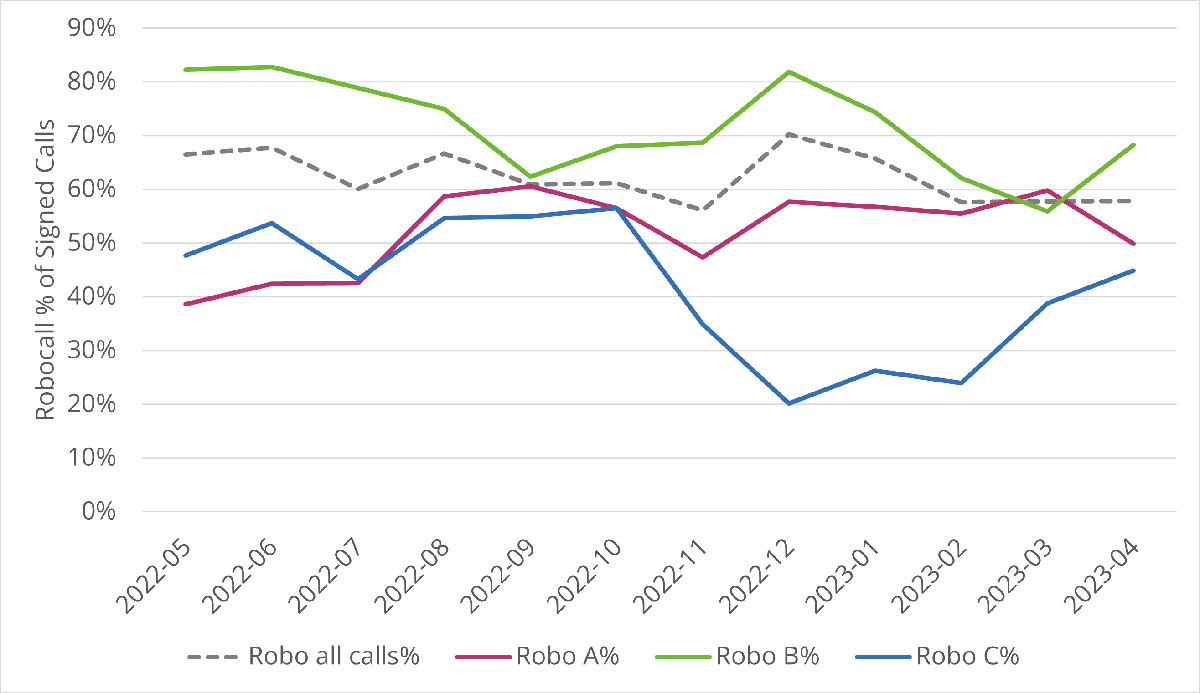
Figure 9. Robocall Percentage by Attestation—Prolific Robocall Signers by Robocall %
Figure 9 shows that, a year ago, calls signed with A-level attestation (red line) had the lowest percentage of robocalls of any attestation level. Since August 2022, however, robocalls with A-level attestation increased among these signers. In March 2023, A-level calls had the highest percentage of robocalls of any attestation level for these providers.
More calls getting an A-level attestation
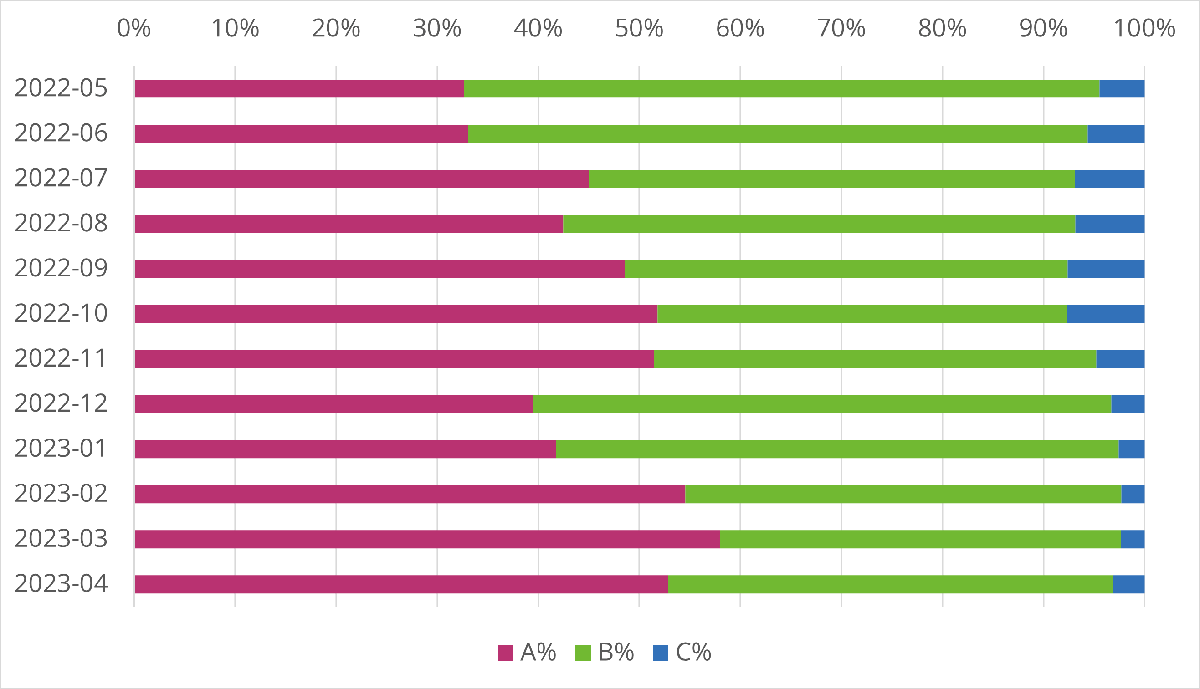
Figure 10. Attestation Allocation—Prolific Robocall Signers by Robocall %
Figure 10 shows the attestation allocations for these providers. Notice that these signers provided full A-level allocation to an increasing percentage of their signed calls, from 33% in May 2022 to 53% in April 2023.
Signing providers with the most robocalls
Robocalls with A-level attestation increasing
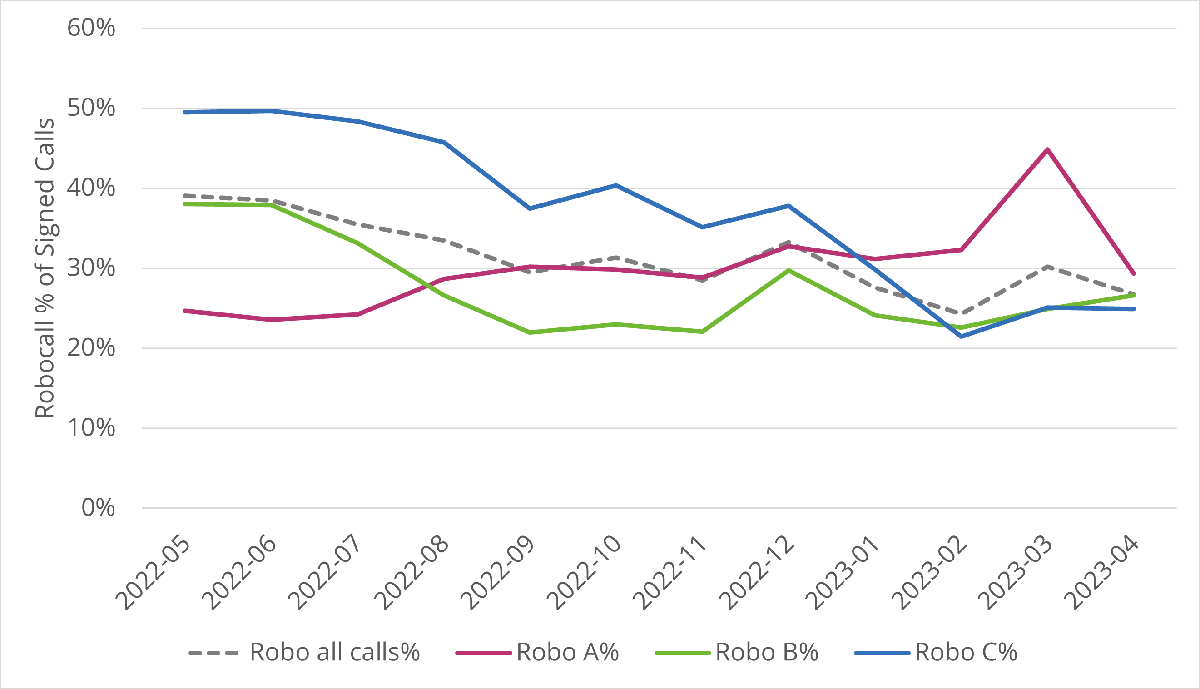
Figure 11. Robocall Percentage by Attestation—Prolific Robocall Signers by Number of Robocalls
Figure 11 shows a similar pattern among providers with the largest number of robocalls. Calls signed with full A-level attestation initially had a lower percentage of robocalls. By the end of 2022, A-level robocalls caught up and had the highest percentage of robocalls of any attestation level.
A-level Attestation Decreasing
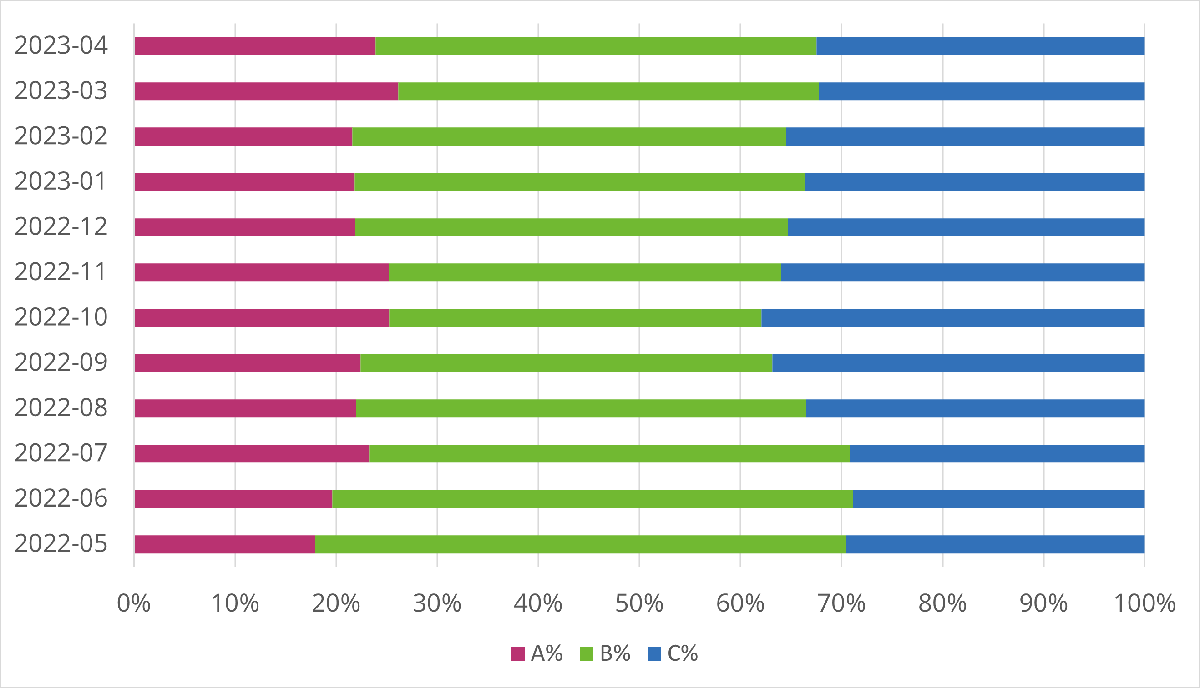
Figure 12. Attestation Allocation—Prolific Robocall Signers by Number of Robocalls
Figure 12 shows that, unlike the high-percentage robocall signers, the allocation of attestation levels has not changed significantly among these signers. If anything, the allocation of A- and C-level attestations is trending down while B-level attestations increased.
Recap
- Robocalls signed with B- or C-level attestation remain a problem among the overall population of SHAKEN signers.
- SHAKEN participation is gaining momentum. The number of SHAKEN-authorized providers increased sharply in April—the biggest monthly jump we’ve seen.
- The percentage of signed calls received at termination remains low, despite increasing SHAKEN participation. This is largely due to the non-IP SHAKEN exemption.
- A deep dive into the data for prolific robocall signers shows increasing robocalls signed with full A-level attestation.
- High-percentage robocall signers are signing more calls, and robocalls, with full A-level attestation.
- High-volume robocall signers are signing more robocalls with full attestation, but they are signing fewer calls overall with full attestation.
Our thoughts
What’s driving these trends? We suspect that the high-percentage prolific robocall signers might be inflating attestation levels for market-driven reasons. They want the business, and if they don’t sign those calls with full A-level attestation, their competitors will.
There might be different explanations for prolific robocall signers with the most robocalls. We know that some are making serious efforts to curb illegal robocalls. They’re just sending many calls, so their robocall numbers are high.
There are other signing providers in this group whose motives might be questionable. It is not clear how they justify giving A-level attestations, given their typical role in the call path as intermediate providers. However, we would need a more detailed analysis to draw clear conclusions.
Going forward, we expect terminating providers and call analytics providers will consider the reputation of signing providers in their call validation treatment. Prolific robocall signers may find that their poor robocall reputation offsets the benefits they expected to gain by signing robocalls with full A-level attestation.
TransNexus solutions
TransNexus is a leader in developing innovative software to manage and protect telecommunications networks. The company has over 20 years’ experience in providing telecom software solutions including toll fraud prevention, robocall mitigation and prevention, TDoS prevention, analytics, routing, billing support, STIR/SHAKEN and SHAKEN certificate services.
Contact us today to learn more.
Our STIR/SHAKEN products:
- Work with your existing network
- Support SIP and TDM
- Affordable, easy to deploy